From the 21st November and 11th December (2016), the cross-disciplinary (groundwater-sanitation-health) University of Nairobi team conducted water quality analyses in Kisumu in both a densely populated, urban area (Obunga, Manyatta) and a less-densely populated peri-urban area (Kanyakwar). The team, comprising the PI, two co-PIs, a geophysicist, PhD student, 4 Laboratory technologists, 2 MSc students and a Public Health PhD researcher, conducted rapid tests for (faecal) thermotolerant coliforms as well as hydrochemical analyses using newly acquired HydroLab Quanta water quality monitoring kit and Wagtech potable water quality laboratory (Figs. 1 & 2) and geophysical tests (Vertical Electrical Soundings) to assess depth to bedrock in the AfriWatSan Kisumu Urban Observatory.
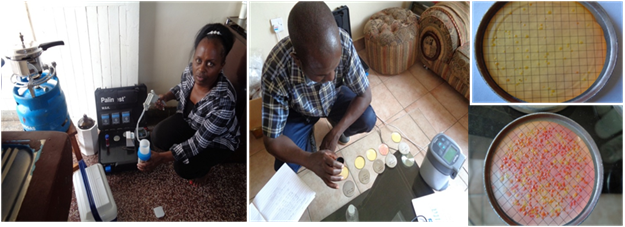
Figure 1: A brief on water sampling, rapid test for feacal contamination and geophysical profiling in Kisumu Observatory between 21st November and 11th December 2016
The results from water quality testing (Table 1, Fig. 3) from springs, surface water, shallow wells and boreholes confirm that shallow groundwater in Kisumu is vulnerable to contamination by faecal contaminants.
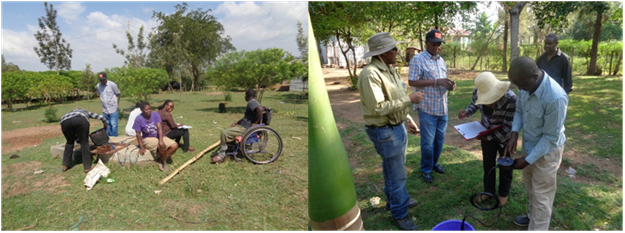
Figure 2: Water sampling and testing using Hydrolab Quanta kit.
Table 1: Physiochemical properties of groundwater from shallow well in Kisumu.
| Locality Name | Source Type | Temp (ºC) |
EC (µS/cm) | DO (mg/L) | pH | Salinity (PSS) | DO (%sat) |
Turbidity (NTU) |
| Kibos | Well | 26.26 | 1490 | 1.18 | 6.8 | 0.75 | 23.2 | 9.1 |
| Upper Otonglo | Well | 25.7 | 665 | 2.01 | 7.2 | 0.32 | 26.7 | 3.7 |
| Kotetni | Well | 26.4 | 2800 | 2.53 | 7 | 2.01 | 29.8 | 1.5 |
| Kotetni 2 | Well | 27.2 | 1820 | 1.72 | 7.2 | 0.54 | 23 | 6.2 |
| Otonglo | Well | 26.0 | 800 | 4.2 | 7.4 | 0.39 | 57 | 12.2 |
| Wandega | Well | 23.9 | 232 | 3.49 | 6.5 | 0.01 | 33.2 | 18 |
Eleven VES were conducted to determine suitable sites for piezometer construction and consequent installation of dataloggers along predetermined transects within the study area in Kisumu (Table 2).
Table 2: Depth to the bedrock of the shallow aquifer in Kisumu based on VES interpretation.
|
No. |
Location Name | x | y | z | Recommended Depth (m) |
| 1 | Kudho_Pri_Sch | 695950 | 9991946 | 1151 | 40 |
| 2 | Kogweno_Springs | 693839 | 9992014 | 1155 | 35 |
| 3 | Erasto_Saye_well | 691093 | 9992908 | 1194 | 50 |
| 4 | Nyahera_Springs | 691626 | 9996786 | 1431 | 50 |
| 5 | Wandiege_Pri_Sch | 698155 | 9988152 | 1136 | 30 |
| 6 | Mbeme_well | 700208 | 9989585 | 1155 | 30 |
| 7 | KEWI_Well | 701185 | 9991625 | 1171 | 50 |
| 8 | Lutheran_Tech_Inst | 698943 | 9993774 | 1196 | 35 |
| 9 | Kokelo_Borehole | 698393 | 9998797 | 1272 | 35 |
| 10 | Kindu_Pri_Sch | 700302 | 9998335 | 1226 | 35 |
| 11 | Korando_Well | 688483 | 9992326 | 1170 | 25 |
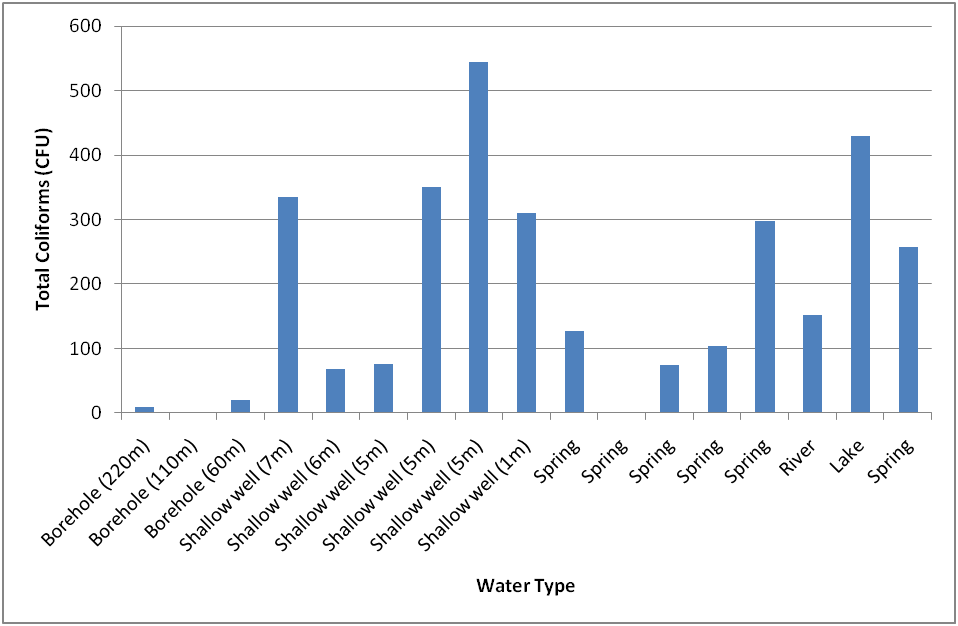
Figure 3: Comparative contamination of groundwater sources in Kisumu.