As part of its Afriwatsan research project activities in Dakar, the Hydrogeologist research team undertook a field mission focused on groundwater sampling, in-situ data collection and Data-logger installation. This campaign started from the 19th to 22th April 2017.
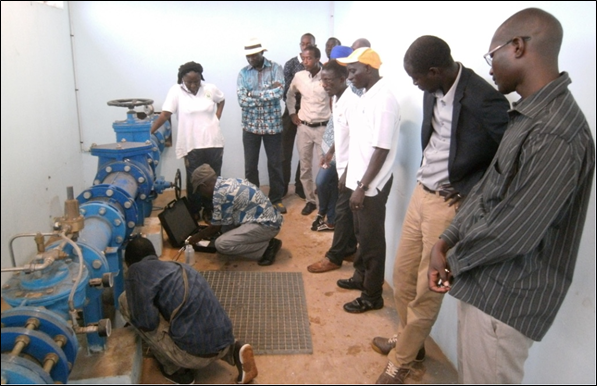
Figure 1: Water sampling from a borehole
The team included the Principal Investigator (Pl), 3 hydrogeologist supervisors, 2 Phd students and 1 MSc student. The mission involved a network of hydraulic structures located in the peri-urban (Thiaroye) and the rural area. It follows a similar first campaign carried out last year with the University Cheikh Anta Diop cross-disciplinary (groundwater-sanitation-health) team.
The implementation of the campaign required the use of suitable new field materials:
* Hydrolab Quanta Multiparameter probe for the in-situ measurement of physico-chemical parameters (pH, electrical conductivity, temperature, dissolved oxygen, salinity and turbidity);
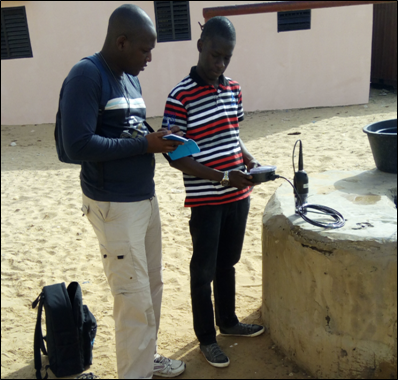
Figure 2: measurement of physico-chemical parameters with Hydrolab Quanta
* water level meter for water level measurement;
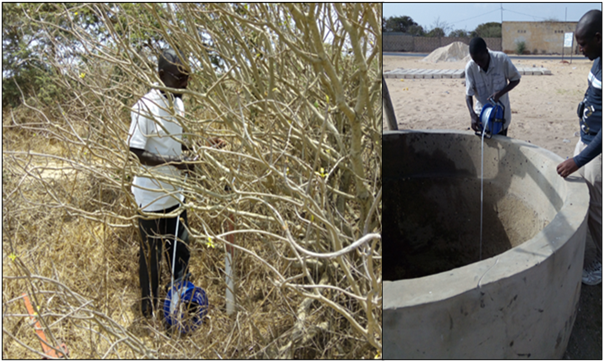
Figure 3: Measurement of the depth to water table with a water level meter equiped with LED and buzzer: Left: in a piezometer; Right: in a Dug well
* “Rugged Troll”, “Aqua Troll” et “Baro Troll” data-loggers for in-situ continual measurement of water levels, electrical conductivities and temperatures.
The field campaign involved 4 types of hydraulic structures spread over a network covering the entire surface of the Quaternary sands of Thiaroye. It has been listed 7 boreholes, 13 piezometers, 25 dug wells and 6 “Diambar” hand-pumps, implanted in several types of environments.
The following table summarizes the datas collected during the field campaign.
| Table 1: Summary statistics of the field campaign’s results | ||||
| Parameters | Min | Max | Average | S.deviation |
| Depth (m) | 1 | 14,2 | 4 | 2,8 |
| Turbidity (NTU) | 0 | 52,7 | 9,8 | 12,6 |
| Salinity (Pss) | 0 | 1,9 | 0,9 | 0,6 |
| Temperature (°c) | 24 | 29 | 27 | 1 |
| DO (mg/l) | 0,6 | 19,2 | 6 | 3,3 |
| EC (µS/cm) | 12,0 | 3600 | 1650,6 | 979,3 |
| pH | 4,5 | 9,1 | 7,1 | 0,8 |
The following maps shows the spartial distribution of the hydraulic structures, depths and electrical conductivities for the various water points in the thiaroye area.
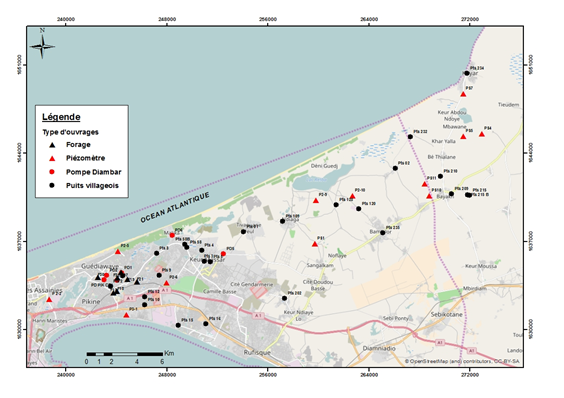 Figure 4 : water points in the study area
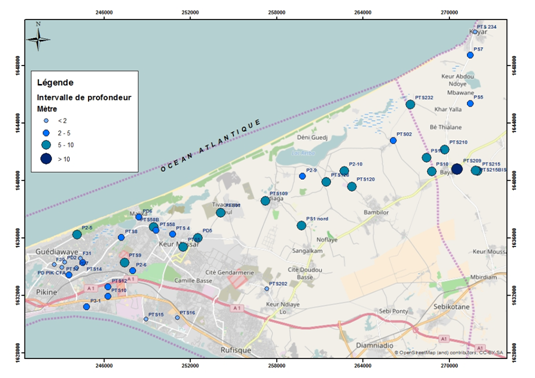
Figure 5: Spatial distribution of the depths to water table
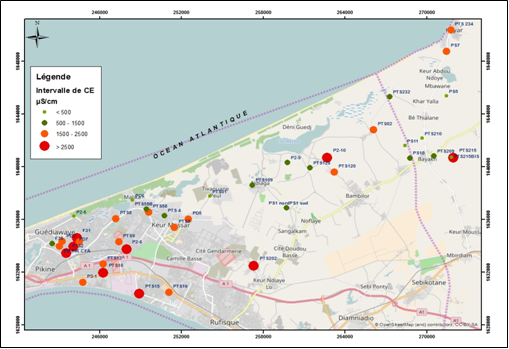
Figure 6: Spatial distribution of the Electrical conductivities
The results of the mission undertaken in the Thiaroye area, summarized in the table below and in the different maps show globally a superficial water table depth at 4 meters with high mineralization.